
VANCOUVER, BC, July 8, 2025 - Banyan Gold Corp. (the "Company" or "Banyan") (TSX-V: BYN) (OTCQB: BYAGF) is pleased to announce the first Indicated Mineral Resources with the updated Mineral Resource Estimate (the “MRE” or the “Mineral Resource”) prepared in accordance with National Instrument 43-101, Standards for Disclosure for Mineral Projects (“NI 43-101”) for the AurMac Project (“AurMac” or the “Project”), Yukon Territory. The updated MRE incorporates an additional 21,000 metres (“m”) from 118 diamond drillholes collared within the Airstrip and Powerline deposits of AurMac completed in 2024 (Figure 1). AurMac is road accessible and is transected by an existing transmission line of the Yukon’s power grid.
“Within the sensitivity table, the contiguous higher-grade zones are highlighted with 1.42 Moz of Indicated Mineral Resources at 0.95 g/t (46.4 M tonnes) and 3.13 Moz of Inferred Mineral Resources at an average gold grade of 0.98 g/t (99.2 M tonnes), at the 0.55 g/t gold cut off,” stated Tara Christie, President and CEO. “This update achieved the primary objectives of last year’s program, which were to convert over 2 million ounces into Indicated Mineral Resources with a refined geological model and importantly identify near surface, high-grade areas.”
The updated MRE comprises an Indicated Mineral Resource of 2.274 million (“M”) ounces (“oz”) of gold (“Au”) (112.5 M tonnes at 0.63 g/t) and an Inferred Mineral Resource of 5.453 Moz of Au (280.6 M tonnes at 0.60 g/t ) (as defined in the Canadian Institute of Mining, Metallurgy and Petroleum (“CIM”) Definition Standards for Mineral Resources & Mineral Reserves incorporated by reference into NI 43‑101). The updated MRE is summarized below in Table 1 (Figure 1). The AurMac Project pit constrained MRE is contained in two near/on-surface deposits: The Airstrip and Powerline deposits.
Table 1: Pit-Constrained Indicated and Inferred Mineral Resources – AurMac Project
|
|
Indicated MRE |
Inferred MRE |
|||||
|
Deposit |
Au Cut-Off Grade (g/t) |
Tonnage (M Tonnes) |
Gold Grade (g/t) |
Gold Content (Oz) |
Tonnage (M Tonnes) |
Gold Grade (g/t) |
Gold Content (oz) |
|
Airstrip |
0.30 |
27.7 |
0.69 |
0.611 |
10.1 |
0.75 |
0.245 |
|
Powerline |
0.30 |
84.8 |
0.61 |
1.663 |
270.4 |
0.60 |
5.208 |
|
Total Combined |
0.30 |
112.5 |
0.63 |
2.274 |
280.6 |
0.60 |
5.453 |
Notes to Table 1:
- The effective date for the MRE is June 28, 2025.
- Mineral Resources which are not Mineral Reserves do not have demonstrated economic viability. The estimate of Mineral Resources may be materially affected by environmental, permitting, legal, title, taxation, sociopolitical, marketing, changes in global gold markets or other relevant issues.
- The CIM Definition Standards were followed for classification of Mineral Resources. The quantity and grade of reported Inferred Mineral Resources in this estimation are uncertain in nature and there has been insufficient exploration to define these Inferred Mineral Resources as an Indicated Mineral Resource.
- Mineral Resources are reported at a cut-off grade of 0.30 g/t gold for all deposits, using a US$/CAN$ exchange rate of 0.73 and constrained within an open pit shell optimized with the Lerchs-Grossman algorithm to constrain the Mineral Resources with the following estimated parameters: gold price of US$2,050/ounce, US$2.50/t mining cost, US$10.00/t processing cost, US$2.00/t G+A, 90% gold recoveries, and 45° pit slopes.[1]
- The number of tonnes and ounces was rounded to the nearest thousand. Any discrepancies in the totals are due to rounding effects.
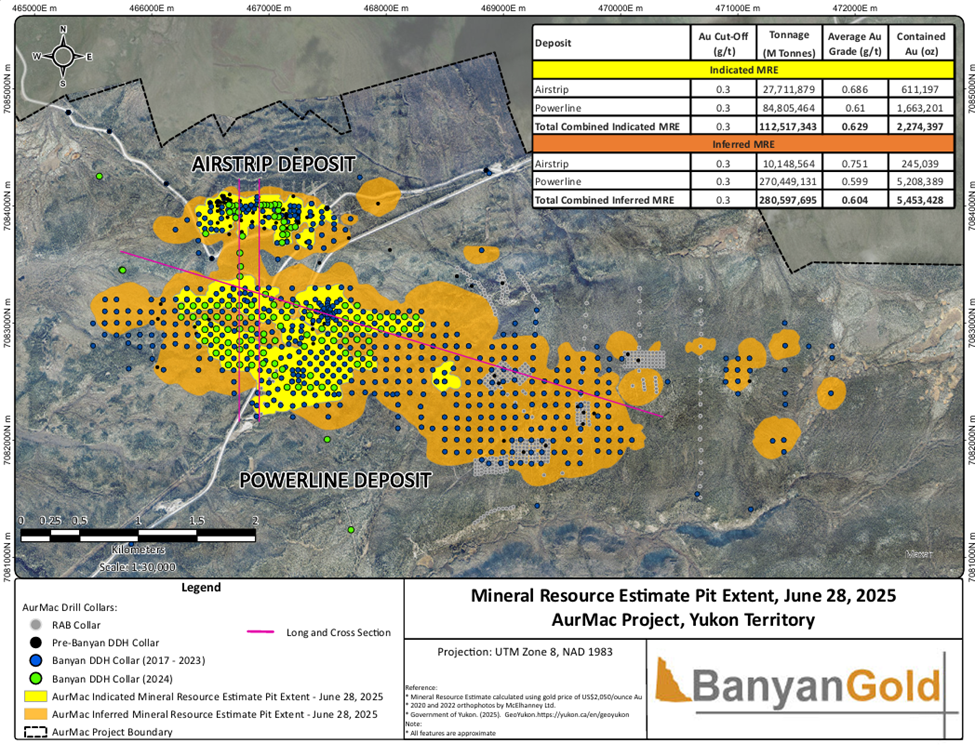
Figure 1. Plan Map Showing the Mineral Resource Estimate and Drill Collar Locations
A technical report prepared in accordance with NI 43-101 supporting the updated Mineral Resource (the "Technical Report") will be filed on SEDAR at www.sedarplus.ca within 45 days of this release. The pit outlines used to constrain the MRE are shown in Figure 1. Additional information on the AurMac Project and a 3-D visualization can be found at: https://www.banyangold.com
Powerline Deposit
The drill data for the Powerline deposit is comprised of 1,043 drill holes, representing an increase of 89 holes from the February 6, 2025 MRE (originally published in 2024).
A new geology model was developed at Powerline by the Banyan geology team for this mineral resource update. The updated model uses lithologic units identified through geochemical variations, to constrain mineralization. This new model differs from the extents of mineralized envelopes previously used at Powerline; which Banyan Management feels is an improvement on the original geologic model; refined and updated based on additional diamond drilling across the Project.
Powerline mineralization is predominantly hosted in 1-3 (up to 25) cm-thick quartz veins. Veins in Powerline associated with gold mineralization are discordant relative to stratigraphy and main foliation, with an average of 14° toward an azimuth of 338° and are interpreted as younger, cross-cutting features. Certain lithologic domains, which are favourable hosts for quartz veining, are interpreted to act as a broad control on mineralization. Detailed analysis of structural and geochemical controls on mineralization as well as interpretation of vein systems are ongoing following infill drilling from 2024, with the goal of further refinement of the geologic model for Powerline.
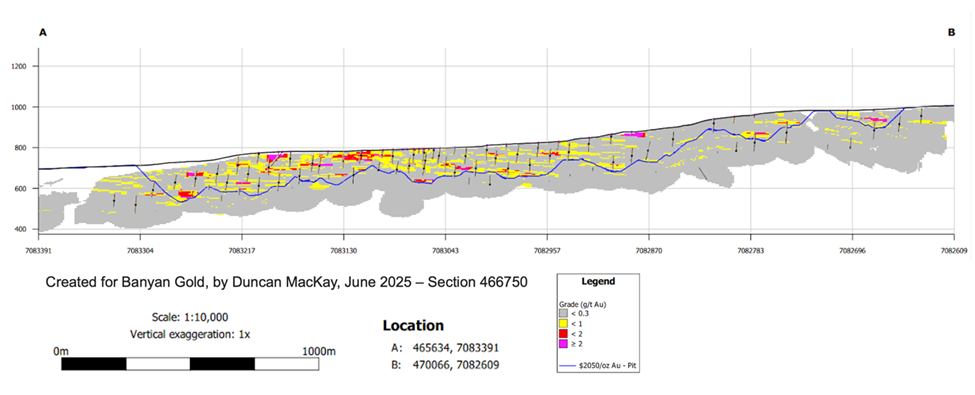
Figure 2: Long Section through Powerline MRE block model. Several continuous mineralized zones >1 g/t Au are present near surface in the central and western portion of the deposit. Resource blocks are 10 m x 10 m x 5 m. Only blocks >0.3 g/t Au cutoff and within the $2,050/oz Au pit shell are included in the MRE.
The most common sampling length of the Powerline deposit is 1.5 m, accounting for approximately 20% of the sample data and is the composite length; over 60% of samples are equal to or below the composite length. Capping of high-grade outliers was carried out for each mineralized zone and ranged from 1.7 g/t gold to 17.0 g/t gold.
The estimation of gold grades into a block model was carried out with the Ordinary Kriging (“OK”) technique on capped composites with the resultant block model comprised of a parent block size of 10 m (easting) x 10 m (northing) x 5 m (elevation) and a sub-block size of 1 m (easting) x 1 m (northing) x 1 m (elevation). Density was calculated from a total of 12,563 measurements from the drill core. The average density per lithology type was assigned to the corresponding blocks.
At a 0.30 g/t gold cut-off, the pit-constrained, Indicated Mineral Resources for Powerline are 84.8 million tonnes at an average gold grade of 0.61 g/t for a total of 1,663,000 ounces of gold and Inferred Mineral Resources for Powerline are 270.4 million tonnes at an average gold grade of 0.60 g/t for a total of 5,208,000 ounces of gold. Cut-off grade sensitivities for the Powerline deposit are presented in Table 2.
Table 2. Pit-Constrained Indicated and Inferred Mineral Resources – Powerline Deposit
|
|
Indicated MRE - Powerline |
Inferred MRE – Powerline |
||||
|
Au Cut-Off Grade (g/t) |
Tonnage (Tonnes) |
Gold Grade (g/t) |
Gold Content (Oz) |
Tonnage (Tonnes) |
Gold Grade (g/t) |
Gold Content (oz) |
|
0.05 |
231,640,645 |
0.32 |
2,405,516 |
1,032,259,114 |
0.26 |
8,728,416 |
|
0.10 |
192,538,290 |
0.37 |
2,308,963 |
781,124,091 |
0.32 |
8,136,844 |
|
0.15 |
157,033,478 |
0.43 |
2,165,911 |
582,100,032 |
0.39 |
7,354,974 |
|
0.20 |
127,533,445 |
0.49 |
2,000,944 |
444,533,601 |
0.46 |
6,588,651 |
|
0.25 |
104,035,379 |
0.55 |
1,832,958 |
344,740,385 |
0.53 |
5,863,255 |
|
0.30 |
84,805,464 |
0.61 |
1,663,201 |
270,449,131 |
0.60 |
5,208,389 |
|
0.35 |
69,672,238 |
0.67 |
1,505,289 |
212,061,104 |
0.68 |
4,602,097 |
|
0.40 |
57,562,113 |
0.74 |
1,360,238 |
171,279,758 |
0.75 |
4,113,558 |
|
0.45 |
47,903,250 |
0.80 |
1,227,480 |
139,241,117 |
0.82 |
3,675,375 |
|
0.50 |
40,063,877 |
0.86 |
1,109,040 |
116,590,672 |
0.89 |
3,328,647 |
|
0.55 |
33,827,467 |
0.92 |
1,003,835 |
94,271,177 |
0.97 |
2,952,085 |
|
0.60 |
28,470,259 |
0.99 |
904,356 |
77,465,386 |
1.06 |
2,642,494 |
|
0.65 |
24,066,935 |
1.06 |
816,327 |
66,669,747 |
1.13 |
2,426,421 |
|
0.70 |
20,573,232 |
1.12 |
740,157 |
56,934,605 |
1.21 |
2,214,893 |
|
0.75 |
17,538,790 |
1.19 |
669,895 |
48,691,460 |
1.29 |
2,022,583 |
|
0.80 |
15,104,216 |
1.25 |
608,957 |
42,015,950 |
1.38 |
1,857,410 |
|
0.85 |
13,155,783 |
1.32 |
557,472 |
36,783,461 |
1.45 |
1,718,340 |
|
0.90 |
11,456,051 |
1.38 |
509,756 |
32,326,323 |
1.53 |
1,593,270 |
|
0.95 |
10,111,629 |
1.45 |
469,764 |
28,980,449 |
1.60 |
1,493,584 |
|
1.00 |
8,983,837 |
1.50 |
434,411 |
26,064,344 |
1.67 |
1,401,954 |
Notes to Table 2:
- The effective date for the MRE is June 28, 2025.
- Mineral Resources, which are not Mineral Reserves, do not have demonstrated economic viability. The estimate of Mineral Resources may be materially affected by environmental, permitting, legal, title, taxation, sociopolitical, marketing, changes in global gold markets or other relevant issues.
- The CIM Definition Standards were followed for the classification of Inferred Mineral Resources. The quantity and grade of reported Inferred Mineral Resources in this estimation are uncertain in nature and there has been insufficient exploration to define these Inferred Mineral Resources as an Indicated Mineral Resource.
- Mineral Resources are reported at a cut-off grade of 0.30 g/t gold, using a US$/CAN$ exchange rate of 0.73 and constrained within an open pit shell optimized with the Lerchs-Grossman algorithm to constrain the Mineral Resources with the following estimated parameters: gold price of US$2,050/ounce, US$2.50/t mining cost, US$10.00/t processing cost, US$2.00/t G+A, 90% recoveries, and 45° pit slopes.
- The number of tonnes and ounces was rounded to the nearest thousand. Any discrepancies in the totals are due to rounding effects.
Airstrip Deposit
The Airstrip deposit is delineated by 151 drill holes, representing an increase of 12 drill holes from the February 6, 2025 MRE (originally published in 2024). Topographic control was from a detailed LIDAR survey dataset.
The Airstrip lithological model is comprised of eight (8) east-west striking units, with six (6) of the units dipping at 35-40° to the south. Gold mineralization is predominantly hosted in two calcareous metasedimentary packages (CAL1 and CAL2 in Figure 3); the upper unit is roughly 90 m-thick east-west striking and dipping approximately 40° to the south, and a lower unit approximately 10 m thick with the same orientation as the upper unit. A felsic dyke intruded the country rock (approximately 10 m-thick with several splays) and strikes approximately 080° and dips 60° to the south. A zone of relatively high-grade gold mineralization is associated with the contact between the calcareous metasediment and the felsic dyke; this zone is near-surface in the north of Airstrip and is open along strike and up-dip, as well as at depth locally.
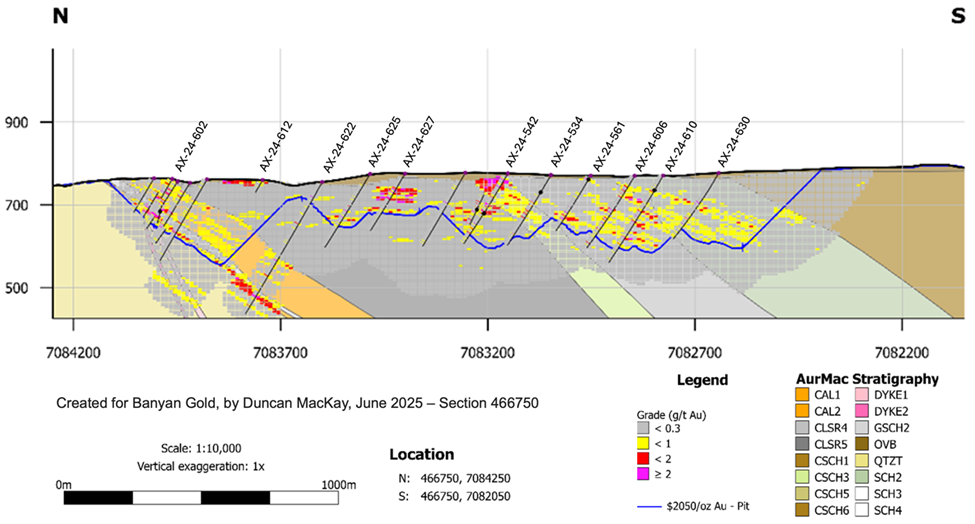
Figure 3: Cross Section through Airstrip (north) and Powerline (south) MRE block model. Several continuous mineralized zones >1 g/t Au are present near surface in the Airstrip and Powerline Deposits. Mineralization is predominantly hosted in calcareous metasedimentary units which are used to constrain the MRE block model. Resource blocks are 10 m x 10 m x 5m. Only blocks >0.3 g/t Au cutoff and within the $2050/oz Au pit shell are included in the MRE.
The most common sampling length of the Airstrip deposit is 1.5 m accounting for approximately 35% of the sample data; all composites were constructed at this interval with >75% of all samples equal to or below this length. Capping of high-grade outliers was based on lithological domains and varied from 0.6 g/t gold to 15.0 g/t gold.
The estimation of gold grades into a block model was carried out with the OK technique on capped composites and the resultant block model comprised of a block size of 10 m (easting) x 10 m (northing) x 5 m (elevation) and sub-block size of 1m (easting) x 1 m (northing) x 1 m (elevation). Density was calculated from a total of 12,563 measurements from the drill core. The average density per lithology type was assigned to the corresponding blocks.
At a 0.30 g/t gold cut-off, the pit-constrained, Indicated Mineral Resources for the Airstrip deposit are 27.7 million tonnes at an average gold grade of 0.69 g/t for a total of 611,000 ounces of gold and Inferred Mineral Resources for the Airstrip deposit are 10.1 million tonnes at an average gold grade of 0.75 g/t for a total of 245,000 ounces of gold. Cut-off grade sensitivities for the Airstrip deposit are presented in Table 3.
Table 3: Pit-Constrained Indicated and Inferred Mineral Resources – Airstrip Deposit
|
|
Indicated MRE - Airstrip |
Inferred MRE - Airstrip |
||||
|
Au Cut-Off Grade (g/t) |
Tonnage (Tonnes) |
Gold Grade (g/t) |
Gold Content (Oz) |
Tonnage (Tonnes) |
Gold Grade (g/t) |
Gold Content (oz) |
|
0.05 |
58,263,499 |
0.41 |
775,511 |
27,691,134 |
0.37 |
325,846 |
|
0.10 |
51,106,468 |
0.46 |
759,117 |
21,263,806 |
0.45 |
310,376 |
|
0.15 |
44,602,068 |
0.51 |
732,769 |
17,436,442 |
0.53 |
295,433 |
|
0.20 |
38,707,557 |
0.56 |
699,396 |
14,430,644 |
0.60 |
278,837 |
|
0.25 |
33,105,080 |
0.62 |
658,834 |
12,144,908 |
0.67 |
262,394 |
|
0.30 |
27,711,879 |
0.69 |
611,197 |
10,148,564 |
0.75 |
245,039 |
|
0.35 |
23,260,845 |
0.76 |
564,629 |
8,798,848 |
0.82 |
230,838 |
|
0.40 |
19,746,911 |
0.82 |
522,504 |
7,573,318 |
0.89 |
216,217 |
|
0.45 |
16,849,539 |
0.89 |
483,219 |
6,497,179 |
0.96 |
201,369 |
|
0.50 |
14,372,513 |
0.96 |
445,452 |
5,524,451 |
1.05 |
186,674 |
|
0.55 |
12,531,274 |
1.03 |
414,171 |
4,953,325 |
1.11 |
177,089 |
|
0.60 |
10,934,051 |
1.10 |
384,934 |
4,503,924 |
1.17 |
168,697 |
|
0.65 |
9,617,878 |
1.16 |
358,388 |
4,055,092 |
1.23 |
159,708 |
|
0.70 |
8,495,462 |
1.22 |
334,045 |
3,652,682 |
1.29 |
151,023 |
|
0.75 |
7,525,408 |
1.29 |
311,386 |
3,374,339 |
1.33 |
144,505 |
|
0.80 |
6,730,351 |
1.35 |
291,688 |
3,092,595 |
1.38 |
137,511 |
|
0.85 |
5,989,662 |
1.41 |
272,104 |
2,726,248 |
1.46 |
127,707 |
|
0.90 |
5,417,534 |
1.47 |
256,041 |
2,461,875 |
1.52 |
120,310 |
|
0.95 |
4,878,704 |
1.53 |
239,987 |
2,170,044 |
1.60 |
111,699 |
|
1.00 |
4,402,694 |
1.59 |
225,064 |
1,997,616 |
1.66 |
106,292 |
Notes to Table 3:
- The effective date for the MRE is June 28, 2025.
- Mineral Resources, which are not Mineral Reserves, do not have demonstrated economic viability. The estimate of Mineral Resources may be materially affected by environmental, permitting, legal, title, taxation, sociopolitical, marketing, changes in global gold markets or other relevant issues.
- The CIM Definition Standards were followed for the classification of Inferred Mineral Resources. The quantity and grade of reported Inferred Mineral Resources in this estimation are uncertain in nature and there has been insufficient exploration to define these Inferred Mineral Resources as an Indicated Mineral Resource.
- Mineral Resources are reported at a cut-off grade of 0.30 g/t gold, using a US$/CAN$ exchange rate of 0.73 and constrained within an open pit shell optimized with the Lerchs-Grossman algorithm to constrain the Mineral Resources with the following estimated parameters: gold price of US$2,050/ounce, US$2.50/t mining cost, US$10.00/t processing cost, US$2.00/t G+A, 90% gold recovery, and 45° pit slopes.
- The number of tonnes and ounces was rounded to the nearest thousand. Any discrepancies in the totals are due to rounding effects.
Table 4: Combined Pit-Constrained Indicated and Inferred Mineral Resources
|
AIRSTRIP+POWERLINE |
AIRSTRIP+POWERLINE |
|||||||
|
INDICATED MRE |
INFERRED MRE |
|||||||
|
Au Cutoff |
Tonnage |
Au Grade |
Au Content |
Au Cutoff |
Tonnage |
Au Grade |
Au Content |
|
|
g/t |
tonnes |
g/t |
oz |
g/t |
tonnes |
g/t |
oz |
|
|
0.05 |
289,904,144 |
0.34 |
3,181,027 |
0.05 |
1,059,950,248.00 |
0.27 |
9,054,262.53 |
|
|
0.10 |
243,644,758 |
0.39 |
3,068,080 |
0.10 |
802,387,897.00 |
0.33 |
8,447,220.27 |
|
|
0.15 |
201,635,546 |
0.45 |
2,898,679 |
0.15 |
599,536,474.00 |
0.40 |
7,650,407.39 |
|
|
0.20 |
166,241,002 |
0.51 |
2,700,340 |
0.20 |
458,964,245.00 |
0.47 |
6,867,488.31 |
|
|
0.25 |
137,140,459 |
0.57 |
2,491,793 |
0.25 |
356,885,293.00 |
0.53 |
6,125,649.69 |
|
|
0.30 |
112,517,343 |
0.63 |
2,274,397 |
0.30 |
280,597,695.00 |
0.60 |
5,453,427.84 |
|
|
0.35 |
92,933,083 |
0.69 |
2,069,919 |
0.35 |
220,859,952.00 |
0.68 |
4,832,934.77 |
|
|
0.40 |
77,309,024 |
0.76 |
1,882,743 |
0.40 |
178,853,076.00 |
0.75 |
4,329,775.06 |
|
|
0.45 |
64,752,789 |
0.82 |
1,710,698 |
0.45 |
145,738,296.00 |
0.83 |
3,876,743.87 |
|
|
0.50 |
54,436,390 |
0.89 |
1,554,492 |
0.50 |
122,115,123.00 |
0.90 |
3,515,320.59 |
|
|
0.55 |
46,358,741 |
0.95 |
1,418,005 |
0.55 |
99,224,502.00 |
0.98 |
3,129,174.42 |
|
|
0.60 |
39,404,310 |
1.02 |
1,289,290 |
0.60 |
81,969,310.00 |
1.07 |
2,811,191.45 |
|
|
0.65 |
33,684,813 |
1.08 |
1,174,715 |
0.65 |
70,724,839.00 |
1.14 |
2,586,129.69 |
|
|
0.70 |
29,068,694 |
1.15 |
1,074,201 |
0.70 |
60,587,287.00 |
1.21 |
2,365,915.76 |
|
|
0.75 |
25,064,198 |
1.22 |
981,282 |
0.75 |
52,065,799.00 |
1.29 |
2,167,088.02 |
|
|
0.80 |
21,834,567 |
1.28 |
900,645 |
0.80 |
45,108,545.00 |
1.38 |
1,994,920.95 |
|
|
0.85 |
19,145,445 |
1.35 |
829,576 |
0.85 |
39,509,709.00 |
1.45 |
1,846,047.66 |
|
|
0.90 |
16,873,585 |
1.41 |
765,797 |
0.90 |
34,788,198.00 |
1.53 |
1,713,579.89 |
|
|
0.95 |
14,990,333 |
1.47 |
709,751 |
0.95 |
31,150,493.00 |
1.60 |
1,605,283.24 |
|
|
1.00 |
13,386,531 |
1.53 |
659,475 |
1.00 |
28,061,960.00 |
1.67 |
1,508,245.93 |
|
Notes to Table 4:
- The effective date for the MRE is June 28, 2025.
- Mineral Resources, which are not Mineral Reserves, do not have demonstrated economic viability. The estimate of Mineral Resources may be materially affected by environmental, permitting, legal, title, taxation, sociopolitical, marketing, changes in global gold markets or other relevant issues.
- The CIM Definition Standards were followed for the classification of Inferred Mineral Resources. The quantity and grade of reported Inferred Mineral Resources in this estimation are uncertain in nature and there has been insufficient exploration to define these Inferred Mineral Resources as an Indicated Mineral Resource.
- Mineral Resources are reported at a cut-off grade of 0.30 g/t gold, using a US$/CAN$ exchange rate of 0.73 and constrained within an open pit shell optimized with the Lerchs-Grossman algorithm to constrain the Mineral Resources with the following estimated parameters: gold price of US$2,050/ounce, US$2.50/t mining cost, US$10.00/t processing cost, US$2.00/t G+A, 90% gold recovery, and 45° pit slopes.
- The number of tonnes and ounces was rounded to the nearest thousand. Any discrepancies in the totals are due to rounding effects.
Upcoming Events
- The Rule Symposium, Boca Raton, July 7-11, 2025
- Booth #51
- Breakfast Presentation: July 11 at 7:15 AM GMT | Corporate Update featuring Jeff Clark with “Three Reasons Large Gold Deposits Will Get Re-Rated”
- Invest Yukon Property Tours, July 12-14, 2025
- TSX Venture Growth Capital Event, Kelowna, July 18-20, 2025
- Precious Metals Summit, Beaver Creek, September 9-12, 2025
- Corporate Presentation: September 10 at 8:15 AM MDT
- GCFF Conference, Vancouver, September 20, 2025
- 121 Hong Kong, September 24-25, 2025
Quality Assurance, Quality Control Measures and Data Verification
The reported work was completed using industry standard procedures, including a quality assurance/quality control (“QA/QC”) program consisting of the insertion of certified reference materials, field duplicates and coarse blanks into the sample stream and utilizing certified independent analytical laboratories for all assays. Additionally, historic QA/QC data and methodology on the AurMac Project were reviewed and will be summarized in the Technical Report. The qualified persons detected no significant QA/QC issues during review of the data.
A robust system of standards, core duplicates and coarse blanks, was implemented in all Banyan drilling programs and was monitored as chemical assay data became available. All control samples were within accuracy and precision thresholds required to meet data quality standards. These control samples amounted to approximately 10% of all samples submitted to analytical laboratories.
All geological data in the MRE was verified by Ginto Consulting Inc. (“Ginto”) as being accurate to the extent possible and to the extent possible all geological information was reviewed and confirmed. Ginto made site visits to the AurMac Project on September 15th, 2018, November 27th, 2019, August 30th to 31st, 2021, November 5th, 2022, and June 10, 2025 and observed Banyan’s drilling and sampling techniques, as well as viewed AurMac drill core. Ginto confirms that the assay sampling and QA/QC sampling of core by Banyan provides adequate and good verification of the data and believes the work to have been done within the guidelines of NI 43-101.
Technical Report
Additional discussion and disclosure on the updated MRE, AurMac Mineral Resource Model Data Verification, as well as on property earn-in status, underlying royalties and recently completed metallurgical test work will be included in the forthcoming Technical Report to be filed on SEDAR+ within 45 days of this release.
Qualified Persons
The updated Mineral Resource Estimate for the AurMac Project was prepared by Marc Jutras, P.Eng., M.A.Sc., Principal, Ginto Consulting Inc., an independent "Qualified Person" within the meaning of NI 43-101, who has reviewed and approved the contents of this release and has verified the data disclosed as it relates to the MRE. The data was verified by Mr. Jutras using data validation and quality assurance procedures under industry standards.
Duncan Mackay, P.Geo., is a “Qualified Person” as defined under NI 43-101 and has reviewed and approved the content of this news release in respect of all disclosure other than the MRE. Mr. Mackay is Vice President Exploration for Banyan and has verified the data disclosed in this news release, including the sampling, analytical and test data underlying the information.
Analytical Method
Drill core from the 2024 drill program was analyzed at Bureau Veritas Minerals of Vancouver, B.C. utilizing the aqua regia digestion ICP-MS 36-element AQ200 analytical package with FA450 50-gram Fire Assay with AAS finish for gold on all drill core samples.
All core samples were split on-site at Banyan’s core processing facilities. Once split, half of the drill core was placed back in the core box, with the other half of core sampled and securely sealed in a poly bag with one part of a three-part sample tag inserted within. Samples were delivered by Banyan personnel or a dedicated expediter to the Bureau Veritas, Whitehorse preparatory laboratory where samples were prepared and then shipped to Bureau Veritas’s Analytical laboratory in Vancouver, BC for final chemical analysis. A robust system of certified reference materials, half core duplicates and coarse blanks were inserted into the sampling stream. A more robust description of historic analytical procedures will be included in the forthcoming AurMac Technical report to be filed on SEDAR+.
About Banyan
Banyan's primary asset, the AurMac Project is located in Canada’s Yukon Territory. The 215.3 square kilometres (“sq km”) AurMac Project lies 40 kilometres (“km”) from Mayo, Yukon. The AurMac Project is transected by a Yukon highway and benefits from a 3-phase powerline, existing power station and cell phone coverage. Banyan has the right to earn up to a 100% interest, in both the Aurex and McQuesten Properties respectively, subject to certain royalties.
In addition to the AurMac Project, the Company holds the Hyland Gold Project, located 70 km Northeast of Watson Lake, Yukon, along the Southeast end of the Tintina Gold Belt (the “Hyland Project”). The Hyland Project represents a sediment hosted, structurally controlled, intrusion related gold deposit, within a large land package (over 125 sq km), accessible by a network of existing gravel access roads.
Banyan also holds the Nitra Gold Project, a grassroots exploration project located in the Mayo Mining district, approximately 10 km west of the AurMac Gold property. The Nitra Property lies in the northern part of the Selwyn basin and is underlain by metaclastic rocks of the Late Proterozoic Yusezyu Formation of the Hyland Group, similar to lithologies hosting portions of the AurMac Project. Middle Cretaceous Tombstone Plutonic suite intrusions occur along the property including the Morrison Creek and Minto Creek stocks. The property is 100% owned and operated by Banyan Gold Corporation ("Banyan") and covers approximately 313.9 sq km. The property is accessible by road along the Silver Trail Highway, South McQuesten Road and 4x4 roads.
Banyan trades on the TSX Venture Exchange under the symbol “BYN” and is quoted on the OTCQB Venture Market under the symbol “BYAGF”. For more information, please visit the corporate website at or contact the Company.
ON BEHALF OF BANYAN GOLD CORPORATION
(signed) "Tara Christie"
Tara Christie
President & CEO
For more information, please contact:
Tara Christie • 778 928 0556 • tchristie@banyangold.com
Jasmine Sangria • 604 312 5610 • jsangria@banyangold.com
CAUTIONARY STATEMENT: Neither the TSX Venture Exchange, its Regulation Services Provider (as that term is defined in policies of the TSX Venture Exchange) nor OTCQB Venture Market accepts responsibility for the adequacy or accuracy of this release.
No stock exchange, securities commission or other regulatory authority has approved or disapproved the information contained herein.
FORWARD LOOKING INFORMATION: This news release contains forward-looking information, which is not comprised of historical facts and is based upon the Company’s current internal expectations, estimates, projections, assumptions and beliefs. Such information can generally be identified by the use of forwarding-looking wording such as “may”, “will”, “expect”, “estimate”, “anticipate”, “intend(s)”, “believe”, “potential” and “continue” or the negative thereof or similar variations. Forward-looking information involves risks, uncertainties and other factors that could cause actual events, results, performance, prospects and opportunities to differ materially from those expressed or implied by such forward-looking information. Forward looking information in this news release includes, but is not limited to, the Company’s plans for exploration; and statements regarding exploration expectations, prospectivity of the Company's property interests, potential mining processes, pricing assumptions and costs ease and confidence in increasing ounces, exploration or development plans and timelines; mineral resource estimates; mineral recoveries and anticipated mining costs. Factors that could cause actual results to differ materially from such forward-looking information include uncertainties inherent in resource estimates, continuity and extent of mineralization, capital and operating costs varying significantly from estimates, the preliminary nature of metallurgical test results, delays in obtaining or failures to obtain required governmental, environmental or other project approvals, political risks, uncertainties relating to the availability and costs of financing needed in the future, changes in equity markets, inflation, changes in exchange rates, fluctuations in commodity prices, and the other risks involved in the mineral exploration and development industry, enhanced risks inherent to conducting business in any jurisdiction, timing and risk of earning the final 25% earn-in on the Aurex and McQueston properties and those risks set out in Banyan’s public documents filed on SEDAR. Although Banyan believes that the assumptions and factors used in preparing the forward-looking information in this news release are reasonable, undue reliance should not be placed on such information, which only applies as of the date of this news release, and no assurance can be given that such events will occur in the disclosed time frames or at all. Banyan disclaims any intention or obligation to update or revise any forward-looking information, whether as a result of new information, future events or otherwise, other than as required by law.